NIFTY INDEX
Head & Shoulder pattern on NIFTY50
On November 12, 2024, I identified a potential Head and Shoulders pattern forming on the NIFTY 50 Index. This classic reversal pattern could signal a potential bearish move if the price broke below the neckline support. Based on technical projections, the ideal target was set at the depth of the head, marking a significant downside move.
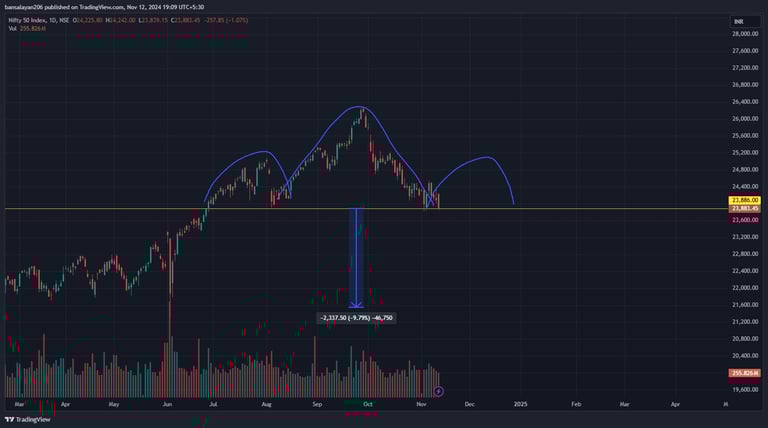
Original Analysis (November 12th, 2024) :
Pattern Identified:
Formation: Head and Shoulders
Left Shoulder: Formed in mid-July 2024
Head: Peaked in September 2024
Right Shoulder: Not developed yet
Neckline Support: Identified around 23,886
Projected Target: Based on the head’s depth, a breakdown could lead to a drop of approximately 10%, bringing NIFTY50 close to 21,600
NIFTY's Chart as on 12th November, 2024
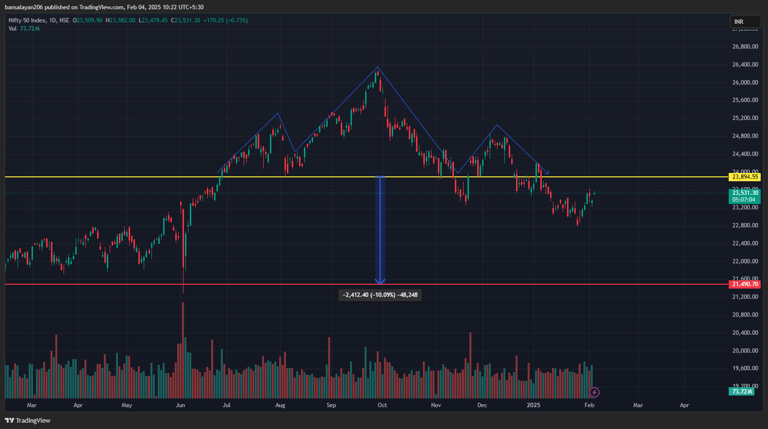
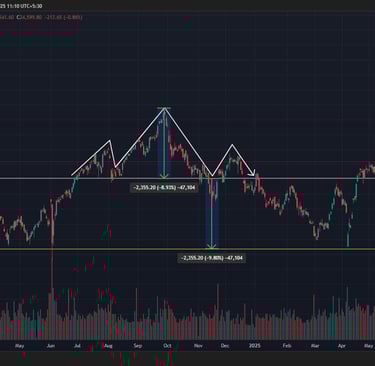
Current Market Analysis (February 4th, 2025) :
First fall below the neckline occurred in mid-November and from there the market bounced back to form the 'Right Shoulder' (peaking at approx. 24,800 level). Hence it was false breakdown
Second fall below the neckline occurred in the latter half of December and it has sustained since then. Hence confirming the breakdown.
The neckline (previous support) will now act as a resistance line.
The next major support is the low of June 4th which NIFTY formed on the Election Day. (~21,280)
According to the projected target from 12th November (~21,600) and the major support of (~21,280), the market could still correct by 8% - 10%.
NIFTY's Chart as on 4th February, 2025
NOTE : I am not a SEBI registered advisor. This blog is just for Educational Purpose and not an Investment Advice.
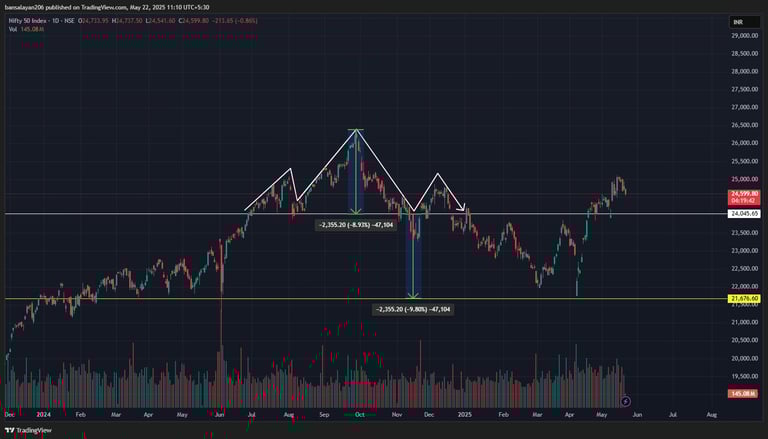
NIFTY's Chart as on 22nd May, 2025
Current Market Analysis (May 22nd, 2025) :
First fall below the neckline occurred in mid-November and from there the market bounced back to form the 'Right Shoulder' (peaking at approx. 24,800 level). Hence it was false breakdown
Second fall below the neckline occurred in the latter half of December and it has sustained since then. Hence confirming the breakdown.
The neckline (previous support) will now act as a resistance line.
The next major support is the low of June 4th which NIFTY formed on the Election Day. (~21,280)
According to the projected target from 12th November (~21,600) and the major support of (~21,280), the market could still correct by 8% - 10%.