NIFTY INDEX
Parallel Price Channel on NIFTY 50
NIFTY 50 Channel Analysis:
As traders and investors, we always seek ways to decode the market's behavior and identify potential price movements in advance. One such effective method is the use of price channels, which can offer a structured framework to gauge market trends and reversals.
The Initial Setup: Charting the Channel
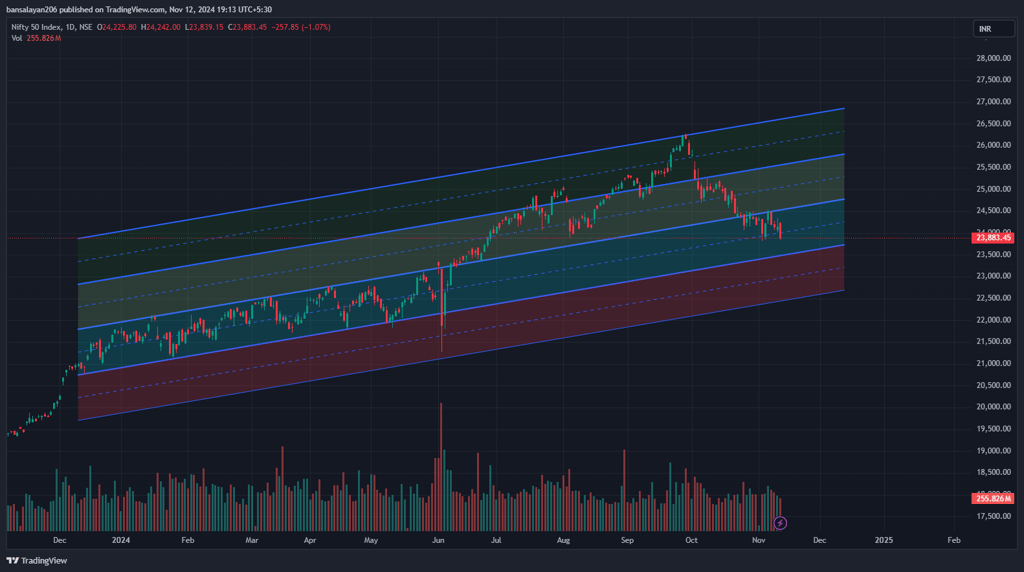
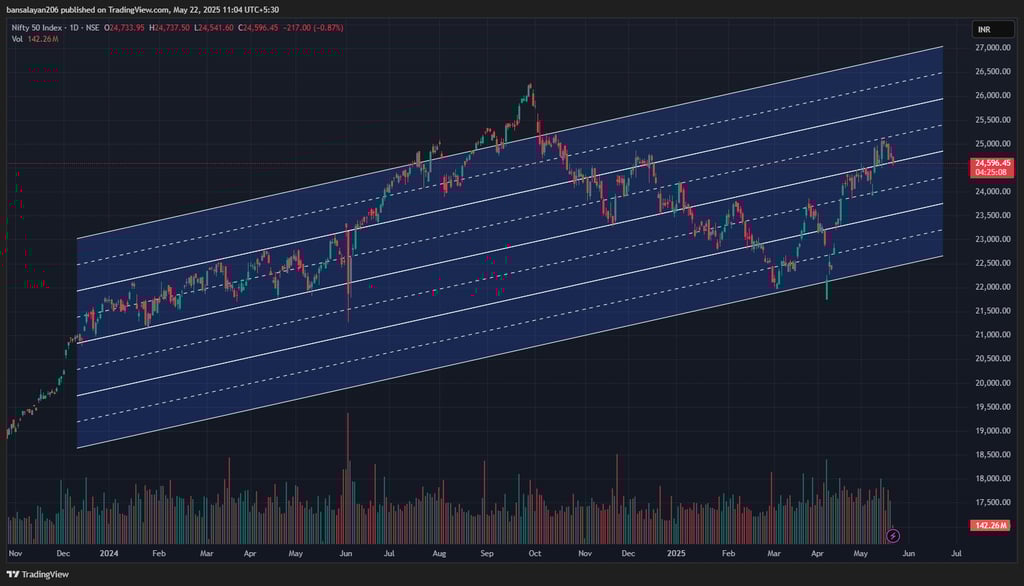
Above is the chart of NIFTY in November, 2024. I constructed a parallel price channel for NIFTY 50 by identifying key support and resistance levels. The primary objective was to outline potential pathways in which the index could trade in the coming months.
Key Observations from the November Chart:
NIFTY had been trading in the blue channel from January, 2024 to the start of June, which was the election week. The price action was moving in an upward-sloping channel, indicating a sustained bullish trend. After breaking out of its blue channel it continued its bullish trend and made an all-time high of 26,200 (approx.) by the end of September, 2024. Since then, it has been in a correction phase and as on 12th November it had corrected by almost 10% and was trading near the lower boundary of the blue channel. I plotted different channels, representing varying levels of support and resistance.
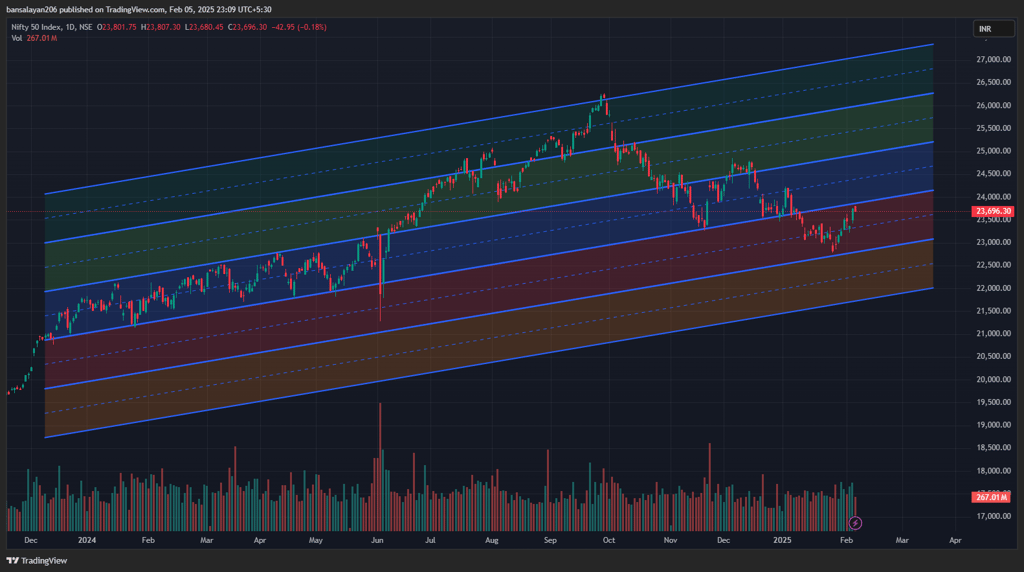
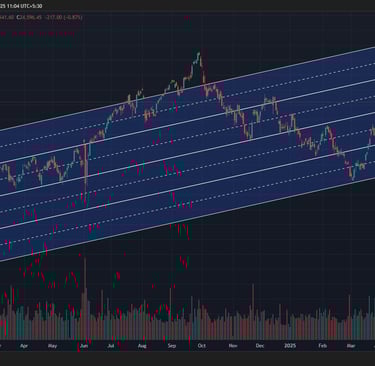
Fast forward to February, 2025 it is evident that the price action has closely adhered to the projected channel structure.
Key Observations:
NIFTY’s price action has respected the support of the blue channel levels on two occasions after breaking down the third time in early January, 2025. After that it has tested the lower support level of the red channel and is now trading near the resistance level. As we move forward, it will be important to watch how NIFTY behaves around the upper and lower red channel limits. If the current trend holds, we could see a continuation toward higher levels, but if a breakdown occurs, towards the orange channel, a re-evaluation of the market structure will be necessary.
NIFTY's chart as on 4th November, 2024
NIFTY's chart as on 5th February, 2025
Fast forward to February, 2025 it is evident that the price action has closely adhered to the projected channel structure.
Key Observations:
NIFTY’s price action has respected the support of the blue channel levels on two occasions after breaking down the third time in early January, 2025. After that it has tested the lower support level of the red channel and is now trading near the resistance level. As we move forward, it will be important to watch how NIFTY behaves around the upper and lower red channel limits. If the current trend holds, we could see a continuation toward higher levels, but if a breakdown occurs, towards the orange channel, a re-evaluation of the market structure will be necessary.
NIFTY's chart as on 22nd May, 2025